Case study · Finance · Data product
Be The Puck Don't chase where the stock is. Chase where it's going.
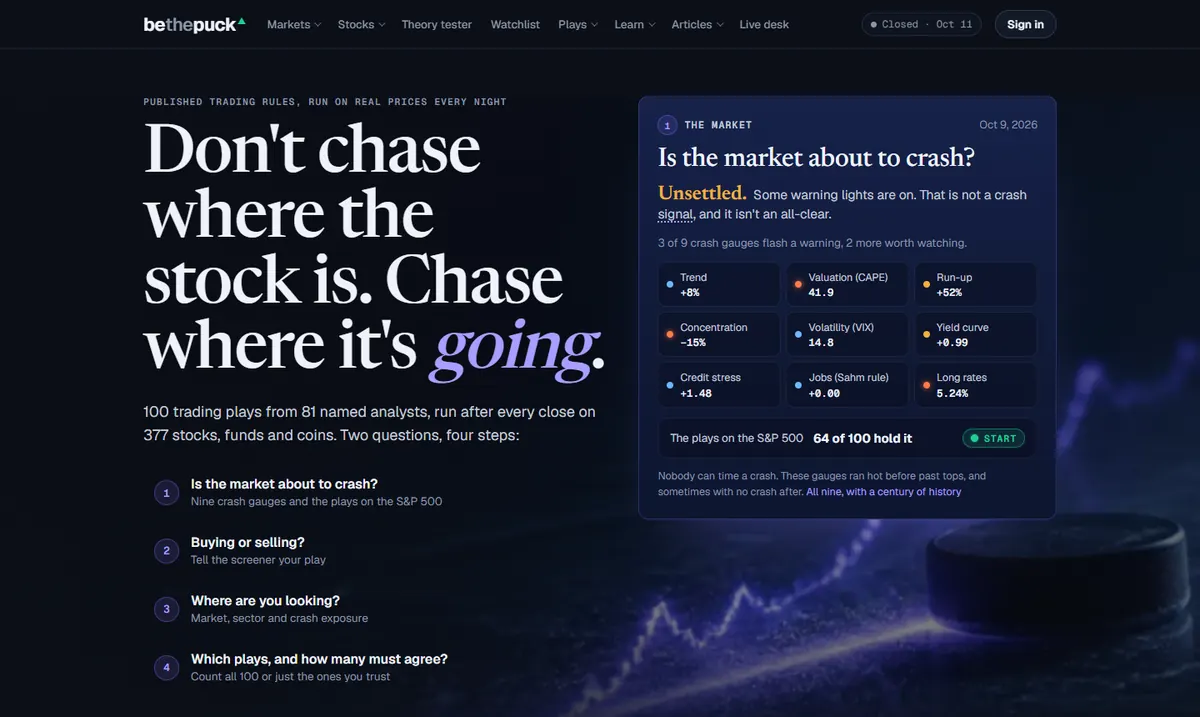
Nine crash gauges and a screener that runs 100 published trading plays on 377 stocks, funds and coins after every close.
01 — The brief
The problem it solves
Self-directed investors ask two questions: is the market about to crash, and which stocks are actually set up well? The answers online are usually one person's opinion, with no record of how often that kind of call has paid.
The brief: publish the rules instead of the opinions. Take 100 trading plays from 81 named analysts, run every one of them on real prices after each close, grade every past call, and show the record — including when the honest answer is that holding would have done better.
02 — What we built
Features that do real work.
Nine crash gauges
Trend, valuation, run-up, concentration, volatility, the yield curve, credit stress, jobs and long rates — each shown against the 2000, 2007, 2020 and 2022 market tops, with the research behind it cited.
A four-step screener
Buying or selling, where to look, how much crash exposure you'll accept, and how many of the 100 plays must agree. The whole search lives in the URL, so it can be shared.
Start / Stop lights
A stock turns Start when 60% of plays hold it and Stop at 40% — the gap stops the light flickering on noise.
Every call, graded
Stock-by-play pages show every past call marked right or wrong, $10,000 since 2005 against buy-and-hold, drawdown, the price that would flip the call and “the case against”.
Call it
A practice game: a real chart is cut off at a past date, you call IN or OUT, then the rest is revealed.
Watchlist and alerts
Keep a watchlist in the browser (or upload a broker CSV) and get a free email when a light flips.
03 — How it's put together
Structure
Every one of the 377 tickers gets a stock page and a page for each of the 100 plays — 37,700 graded stock-by-play pages — alongside guides to every play, profiles of the 81 analysts behind them, and a 24-lesson Learn section.
Under the hood
- Static pages regenerated after each U.S. close from Yahoo Finance, FRED and multpl data, with sources named on the page
- Netlify Functions for accounts and alerts; the screener's state kept entirely in the URL
- Compact stock pages despite candlestick charts, news markers and 17 weightable scoring factors
Details that matter
- Hit rates sit next to the warning that being right often isn't the same as making money
- Analyst profiles are source-checked and flag what couldn't be confirmed — and state there's no affiliation
- Every page says plainly that it isn't trading advice, doesn't know your goals, taxes or timeline, and takes no positions
A data product that earns trust by publishing its own record: 37,700 graded pages that show when the rules worked, when they didn't, and what would change the call.
Want a build
like this one?
Tell us what you're launching. We'll tell you honestly what it needs — and what it doesn't.